Search This Blog

DXER Ham Radio DX News

The latest dx news/current propagation and more. Visit mike's Amateur Radio Page at www.qsl.net/swlham

Showing posts with label 2018 at 10:14AM. Show all posts

Monday, April 23, 2018

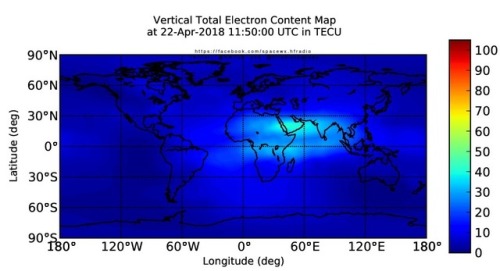
Latest TEC map from NASA. What is TEC? Total Electron Content…

Latest TEC map from NASA. What is TEC? Total Electron Content (or TEC) is an important descriptive quantity for the ionosphere of the Earth. TEC is the total number of free electrons integrated between two points, along a tube of one meter squared cross section, i.e., the electron columnar number density. Affected by solar activity, Total Electron Content (TEC) describes the total number of free electrons present within one square meter between two points (i.e. between the receiver and satellite involved in measuring TEC).

These maps are also used to monitor ionospheric weather, and to nowcast ionospheric storms that often occur responding to activities in solar wind and Earth’s magnetosphere as well as thermosphere.

View live data and images at http://SunSpotWatch.com

Follow: https://Twitter.com/NW7US and https://Twitter.com/hfradiospacewx

Facebook: http://NW7US.us/swhfr

And: Check out the stunning view of our Sun in action, as seen during the last five years with the Solar Dynamics Observatory (SDO):
https://www.youtube.com/watch?v=zXN-MdoGM9g

= = = =

BOOK SALE: Space Weather and Sun Science – get these from Amazon, and help us stay online!

NOTICE: When you buy this (or any item after starting with this link), you are helping us keep our SunSpotWatch.com and other resources “on the air” (up and running!). In other words, you are helping the entire community. So, check out this book:

Here is the link to Amazon:
http://g.nw7us.us/fbssw-aSWSC

= = = =

See the live aurora mapping is at http://aurora.sunspotwatch.com

If you are on Twitter, please follow these two users:

1) https://Twitter.com/NW7US
2) https://Twitter.com/hfradiospacewx

We’re on Facebook: http://NW7US.us/swhfr

from toptenrss https://ift.tt/2Hm37gb
via IFTTT

Sunday, April 22, 2018

Latest TEC map from NASA. What is TEC? Total Electron Content…

Latest TEC map from NASA. What is TEC? Total Electron Content (or TEC) is an important descriptive quantity for the ionosphere of the Earth. TEC is the total number of free electrons integrated between two points, along a tube of one meter squared cross section, i.e., the electron columnar number density. Affected by solar activity, Total Electron Content (TEC) describes the total number of free electrons present within one square meter between two points (i.e. between the receiver and satellite involved in measuring TEC).

These maps are also used to monitor ionospheric weather, and to nowcast ionospheric storms that often occur responding to activities in solar wind and Earth’s magnetosphere as well as thermosphere.

View live data and images at http://SunSpotWatch.com

Follow: https://Twitter.com/NW7US and https://Twitter.com/hfradiospacewx

Facebook: http://NW7US.us/swhfr

And: Check out the stunning view of our Sun in action, as seen during the last five years with the Solar Dynamics Observatory (SDO):
https://www.youtube.com/watch?v=zXN-MdoGM9g

= = = =

BOOK SALE: Space Weather and Sun Science – get these from Amazon, and help us stay online!

NOTICE: When you buy this (or any item after starting with this link), you are helping us keep our SunSpotWatch.com and other resources “on the air” (up and running!). In other words, you are helping the entire community. So, check out this book:

Here is the link to Amazon:
http://g.nw7us.us/fbssw-aSWSC

= = = =

See the live aurora mapping is at http://aurora.sunspotwatch.com

If you are on Twitter, please follow these two users:

1) https://Twitter.com/NW7US
2) https://Twitter.com/hfradiospacewx

We’re on Facebook: http://NW7US.us/swhfr

from toptenrss https://ift.tt/2HEZEN3
via IFTTT

Friday, March 30, 2018

The K7RA Solar Update

ARRL –

We saw no sunspots during this reporting week, March 22-28. The previous week had sunspots on only three days, with an average of 5.6.

Average daily solar flux receded from 69.3 to 68.2. Average daily planetary A index dropped from 14.4 to 10.6, and average mid-latitude A index declined from 11.3 to 8.9.

Predicted solar flux is 70 on March 30 to April 15, 69 on April 16, 68 on April 17-29, 69 on …

from dx news https://ift.tt/2uxklFt
via IFTTT