Search This Blog

DXER Ham Radio DX News

The latest dx news/current propagation and more. Visit mike's Amateur Radio Page at www.qsl.net/swlham

Showing posts with label April 23. Show all posts

Monday, April 23, 2018

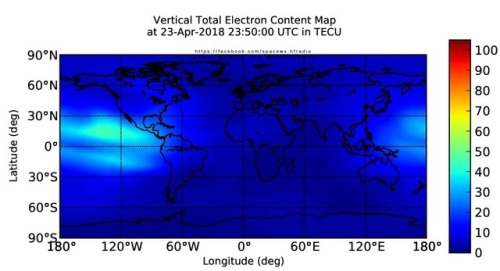
Latest TEC map from NASA. What is TEC? Total Electron Content…

Latest TEC map from NASA. What is TEC? Total Electron Content (or TEC) is an important descriptive quantity for the ionosphere of the Earth. TEC is the total number of free electrons integrated between two points, along a tube of one meter squared cross section, i.e., the electron columnar number density. Affected by solar activity, Total Electron Content (TEC) describes the total number of free electrons present within one square meter between two points (i.e. between the receiver and satellite involved in measuring TEC).

These maps are also used to monitor ionospheric weather, and to nowcast ionospheric storms that often occur responding to activities in solar wind and Earth’s magnetosphere as well as thermosphere.

View live data and images at http://SunSpotWatch.com

Follow: https://Twitter.com/NW7US and https://Twitter.com/hfradiospacewx

Facebook: http://NW7US.us/swhfr

And: Check out the stunning view of our Sun in action, as seen during the last five years with the Solar Dynamics Observatory (SDO):
https://www.youtube.com/watch?v=zXN-MdoGM9g

= = = =

BOOK SALE: Space Weather and Sun Science – get these from Amazon, and help us stay online!

NOTICE: When you buy this (or any item after starting with this link), you are helping us keep our SunSpotWatch.com and other resources “on the air” (up and running!). In other words, you are helping the entire community. So, check out this book:

Here is the link to Amazon:
http://g.nw7us.us/fbssw-aSWSC

= = = =

See the live aurora mapping is at http://aurora.sunspotwatch.com

If you are on Twitter, please follow these two users:

1) https://Twitter.com/NW7US
2) https://Twitter.com/hfradiospacewx

We’re on Facebook: http://NW7US.us/swhfr

from toptenrss https://ift.tt/2Hmwzqr
via IFTTT

YC8AO/P – Bonerate & Taka’ Bonerate Islands, OC-242

Andi, YC8AO announces he will be active from the Bonerate and Taka’ Bonerate Islands OC-242 during April 25-30, 2018. QRV on HF bands. Rajuni Island (April 25-28) Tinabo Island (April 28-30)

from toptenrss https://ift.tt/2qUrdYo
via IFTTT

Beasley Names Ops Manager/PD in Tampa

Today’s Sun (artificially-colored in red) seen at the…

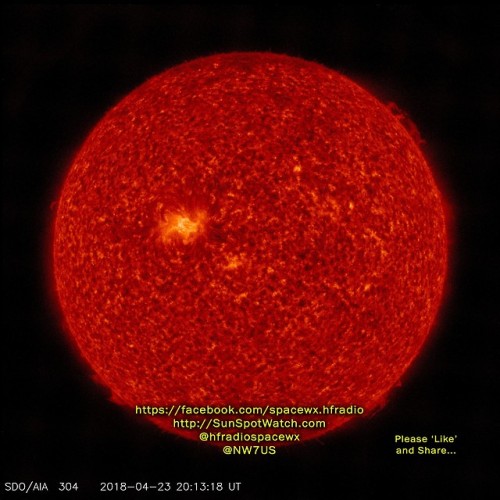
Today’s Sun (artificially-colored in red) seen at the 304-angstrom wavelength (Extreme Ultraviolet, or EUV), as viewed by the Solar Dynamics Observatory (SDO), by the Atmospheric Imaging Assembly (AIA).

At this wavelength, at a wavelength not seen by the un-aided eye, we can see the Sun through the 30.4 nm (304 A) filter. This Extreme Ultraviolet (EUV) waveband is used to monitor the chromosphere and lower transition region. It is useful to see plasma and filament activity, including filamet eruptions and coronal mass ejections (CMEs).

The image is a “false color image’, meaning that observed data are in a range outside of what human eyes can see, so the data are digitally recast into colors that emphasize physically important features. This view is created from data gathered by the Solar Dynamics Observatory (SDO) satellite that flies above Earth’s atmosphere in an inclined geosynchronous orbit.

Emissions captured in this image come from helium (He), the second most abundant element in the solar atmosphere. Singly ionized Helium (He II) emits Extreme Ultraviolet (EUV) light when heated to temperatures of ~70,000 deg K. In the upper solar atmosphere the temperatures are so high that most chemical elements have lost many of their electrons. The remaining electron, which is still attached to the atom, emits EUV radiation in narrow wavebands or lines when it is in an excited state.

The 30.4 nm filter (also called channel or bandpass) is dominated by emissions from singly (once) ionized helium which has missing 1 electron–He II. The roman numeral descriptor is consistent with spectral notation: the level of ionization for a given roman numeral is one unit larger that the actual number of missing electrons. The temperatures associated with this level of ionization is range from 6 x 10^4 K to 8 x 10^4 K.

The bright regions in this image correspond to regions of closed magnetic field loops that trap the hot, emitting plasma. Large bright regions are often called active regions. The dark regions correspond to cooler temperatures and possibly to locations where magnetic field lines open into the heliosphere, and thus, do not trap hot plasma.

View live data and images at http://SunSpotWatch.com

= = = =

BOOK SALE: Space Weather and Sun Science – get these from Amazon, and help us stay online!

NOTICE: When you buy this (or any item after starting with this link), you are helping us keep our SunSpotWatch.com and other resources “on the air” (up and running!). In other words, you are helping the entire community. So, check out this book:

Here is the link to Amazon:
http://g.nw7us.us/fbssw-aSWSC

= = = =

Visit our live space weather and radio propagation web site, at: http://SunSpotWatch.com

See the live aurora mapping is at http://aurora.sunspotwatch.com

If you are on Twitter, please follow these two users:

1) https://Twitter.com/NW7US
2) https://Twitter.com/hfradiospacewx

We’re on Facebook: http://NW7US.us/swhfr

from toptenrss https://ift.tt/2qTsyPe
via IFTTT

Here is the current forecast discussion on space weather and…

Here is the current forecast discussion on space weather and geophysical activity, issued 2018 Apr 23 1230 UTC.

Solar Activity

24 hr Summary: Solar activity was very low. Slight decay was observed in the trailing spots of Region 2706 (N03E22, Cao/beta). No Earth-directed CMEs were observed in available coronagraph imagery.

Forecast: Solar activity is expected to be very low, with a slight chance for C-class flare activity, over the next three days (23-25 Apr).

Energetic Particle

24 hr Summary: The greater than 2 MeV electron flux reached high levels this period with a peak flux of 22,704 pfu at 22/2050 UTC. The greater than 10 MeV proton flux was steady at background levels throughout the period.

Forecast: The greater than 2 MeV electron flux is expected to reach high levels each of the next three days (23-25 Apr) and the greater than 10 MeV proton flux is expected to persist at background levels throughout the forecast period.

Solar Wind

24 hr Summary: Solar wind speed continued to decline over the period from approximately 500 km/s to near 415 km/s. Total field ranged from 3-6 nT while the Bz component was between +/-4 nT. Phi angle was oriented in a negative (towards) sector.

Forecast: Solar wind parameters are expected to continue a slow return to background levels over the course of day one (23 Apr). Background solar wind conditions are expected to prevail on days two and three (24-25 Apr).

Geospace

24 hr Summary: The geomagnetic field was quiet to unsettled.

Forecast: The geomagnetic field is expected to be generally quiet over the next three days (23-25 Apr) under a nominal solar wind regime.

Don’t forget to visit our live space weather and radio propagation web site, at: http://SunSpotWatch.com/

Live Aurora mapping is at http://aurora.sunspotwatch.com/

If you are on Twitter, please follow these two users:
+ https://Twitter.com/NW7US
+ https://Twitter.com/hfradiospacewx

Check out the stunning view of our Sun in action, as seen during the last five years with the Solar Dynamics Observatory (SDO): https://www.youtube.com/watch?v=zXN-MdoGM9g

-=-=-=-=-=-

What’s the difference between CB & amateur (ham) radio? Here ia a video with an opinion by our curator, Tomas (amateur radio operator, NW7US): Did NCIS TV Show Malign the Amateur Radio Service? https://www.youtube.com/watch?v=pIWJ7kKbxiM?t=1m33s

We’re on Facebook: http://NW7US.us/swhfr

from toptenrss https://ift.tt/2HlbIUx
via IFTTT

Puerto Rico: AM Radio makes a comeback post-hurricane

(Source: Columbia Journalism Review)

ON SEPTEMBER 19, 2017—the day before Hurricane Maria made landfall in Puerto Rico—the evening news team at WORA-TV in the coastal city of Mayagüez broadcast its final program before shutting down the station ahead of the storm.

“If Maria was going to be the monster everyone was predicting,” says Carolina Rodriguez Plaza, the news team’s production manager, “we knew the power could be cut off for a long time. We decided to shut down the station and send everyone home.”

Plaza told her team of 12 reporters not to worry, their salaries would be paid during the downtime and their jobs would be waiting for them when broadcasting resumed. Plaza retreated to her parents’ home, where she spent the night of the hurricane watching updates about the storm on cable TV. Then, as happened in homes across Puerto Rico, the lights flickered and the power went out. Hurricane Maria’s 150-mile-per-hour winds toppled power lines and torrential rains grounded out the island’s power grid.

Desperate for news about the disaster befalling her island, Plaza turned on a battery-powered radio and found that a local radio station, WKJB 710 AM, was maintaining its broadcast. The station’s managers had learned a lesson about disaster preparedness in 1998, when Hurricane Georges blew down their radio antenna and cut off the power. Since then, staff had equipped the station with a backup power generator and a reinforced antenna that could withstand hurricane-force winds.

“Maria erased the world of journalism in Puerto Rico,” Plaza says. “It reemerged in a new form, with radio playing an important role.”[…]

Click here to read the full article at the CJR.

from toptenrss https://ift.tt/2qTseju
via IFTTT

YC8AO/P Taka Bonerate Islands. From DXNews.com

Andi, YC8AO will be active as YC8AO/P from Taka Bonerate Islands, IOTA OC – 242, 25 – 30 April 2018.

from toptenrss https://ift.tt/2Hp9dk4
via IFTTT

Daily solar report: Current Sunspot Cycle 24 Activity and Space…

Daily solar report: Current Sunspot Cycle 24 Activity and Space Weather

Sunspot count: Sun Spots: 20 as of 04/22/2018
10.7-cm Radio Flux: 76 SFU (SFU=Solar Flux Units)
Estimated Planetary A-index (Ap): 5 | K-index (Kp): 1

Solar Wind: 413 km/s at 6.0 protons/cm3, Bz is -4.0 nT
(Apr 23, 2018 at 1814 UT)

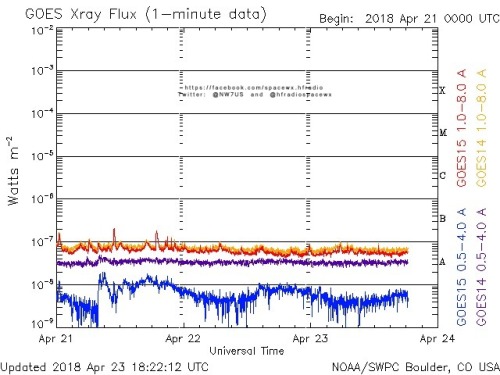
X-ray Solar Flares:
6h hi [none] 24h hi [none]

Background X-ray Level, Last Six Days

Apr 22 2018 :: A5.3
Apr 21 2018 :: A6.2
Apr 20 2018 :: A5.7
Apr 19 2018 :: A3.7
Apr 18 2018 :: A2.7
Apr 17 2018 :: A1.6

Global HF Propagation Conditions for 1800Z on 23 Apr, 2018
High Latitude: Normal
Middle Latitude: Normal
Low Latitude: Normal

Geomagnetic Latitude Ranges: High: 60-90 degrees, Middle: 20-60 degrees, Low: 0-20 degrees

For live data and images, visit http://SunSpotWatch.com

This report has been prepared by your space weather and radio propagation reporter, Tomas ( amateur radio operator, NW7US, http://NW7US.us )

Check out the stunning view of our Sun in action, as seen during the last five years with the Solar Dynamics Observatory (SDO):
https://www.youtube.com/watch?v=zXN-MdoGM9g

= = = =

BOOK SALE: Space Weather and Sun Science – get these from Amazon, and help us stay online!

NOTICE: When you buy this (or any item after starting with this link), you are helping us keep our SunSpotWatch.com and other resources “on the air” (up and running!). In other words, you are helping the entire community. So, check out this book:

Here is the link to Amazon:
http://g.nw7us.us/fbssw-aSWSC

= = = =

Don’t forget: You can also get the space weather and radio propagation self-study course, today. Visit http://nw7us.us/swc for the latest sale and for more information!

= = = =

Visit our live space weather and radio propagation web site, at: http://SunSpotWatch.com

See the live aurora mapping is at http://aurora.sunspotwatch.com

If you are on Twitter, please follow these two users:

1) https://Twitter.com/NW7US
2) https://Twitter.com/hfradiospacewx

We’re on Facebook: http://NW7US.us/swhfr

from toptenrss https://ift.tt/2vCM3kP
via IFTTT

Edison Says Podcasting’s Share of Ear Doubled in Four Years

O’Rielly Puts the Pep Back in Policy and Process

Monticello Media Makes Changes

Adds Salierno, promotes Birckhead

Monticello Media has tapped Ralph Salierno to serve as vice president and general manager of the company’s five Charlottesville, Va., stations. Additionally, Wanda Birckhead has been promoted to director of sales.

Salierno has worked in several markets including Virginia Beach, Va.; Oklahoma City; Memphis, Tenn.; and most recently, Fredericksburg, Va.

Monticello Media is owned by George Reed. Its Charlottesville radio stations are comprised of WCHV(FM), WYCK(FM), WHTE(FM), WKAV(FM) and WZGN(FM).

from toptenrss https://ift.tt/2HKlgHX
via IFTTT

A Three-Station Multiplex Project

Today’s Sun, seen through a filter of…

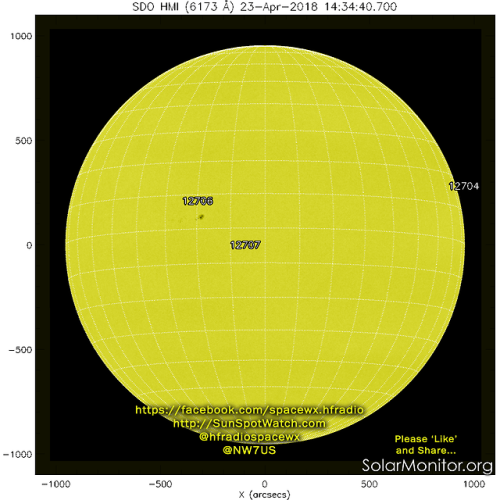
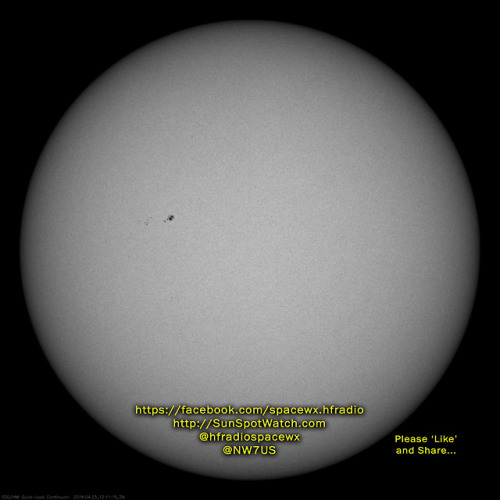
Today’s Sun, seen through a filter of ‘visible’ light (remember: NEVER look directly at the Sun!), as viewed by the Solar Dynamics Observatory (SDO), by the Helioseismic Magnetic Imager (HMI). This image is known as a ‘continuum’ image; a continuum image is formed by filtering portions of the visible light part of the spectrum. The SDO HMI is designed to study oscillations and the magnetic field at the solar surface, or photosphere.

The continuum images allow us to track the evolution of sunspots. These images are important as they allow us to better understand the dynamic nature of the solar atmosphere.

= = = = = =

BOOK SALE: Space Weather and Sun Science – get these from Amazon, and help us stay online!

NOTICE: When you buy this (or any item after starting with this link), you are helping us keep our SunSpotWatch.com and other resources “on the air” (up and running!). In other words, you are helping the entire community. So, check out this book:

Here is the link to Amazon:
http://g.nw7us.us/fbssw-aSWSC

= = = = = =

Visit our live space weather and radio propagation web site, at: http://SunSpotWatch.com

See the live aurora mapping is at http://aurora.sunspotwatch.com

We’re on Facebook: http://NW7US.us/swhfr

Twitter feeds:
https://Twitter.com/NW7US and https://Twitter.com/hfradiospacewx

from toptenrss https://ift.tt/2K9vErk
via IFTTT

Here is this week’s space weather and geophysical report,…

Here is this week’s space weather and geophysical report, issued 2018 Apr 23 0149 UTC.

Highlights of Solar and Geomagnetic Activity 16 – 22 April 2018

Solar activity was very low. Region 2706 (N03, L=281, class/area Dao/130 on 22 Apr) produced the strongest flare of the period, a B5 at 20/1704 UTC. The region continued slow growth through the end of the reporting period. No Earth-directed CMEs were observed in available coronagraph imagery.

No proton events were observed at geosynchronous orbit.

The greater than 2 MeV electron flux at geosynchronous orbit ranged from normal to high levels on 10-20 Apr; high levels on 22 Apr and moderate to high levels for the remaining days of the reporting period. The peak flux observed was 24,100 pfu at 21/2120 UTC.

Geomagnetic field activity was quiet until 20 Apr, when unsettled to G2 (Moderate) geomagnetic conditions were observed in response to CIR ahead of a negative polarity CH HSS. Total field peaked at 23 nT around 20/0510 UTC and slowly declined to around 5 nT by late on 20 Apr. Solar wind speeds were increased from around 290 km/s to a peak of near 620 km/s during the HSS proper late on 20 Apr. The geomagnetic response decreased to quiet to unsettled conditions over 21 Apr and finally to quiet on 22 Apr as influence from the CH HSS waned.

Forecast of Solar and Geomagnetic Activity 23 April – 19 May 2018

Solar activity is expected to be very low throughout the forecast period.

No proton events are expected at geosynchronous orbit.

The greater than 2 MeV electron flux at geosynchronous orbit is expected to be at moderate to high levels on 23-30 Apr and 07-19 May; normal to moderate levels are expected from 01-06 May. Elevated levels of electron flux are expected due to the anticipation of multiple, recurrent CH HSSs.

Geomagnetic field activity is expected to reach unsettled levels on 26 Apr, 06 May, 09-10 May and 19 May; active levels are expected on 27 Apr, 07-08 Apr and 18 May; G2 (Moderate) geomagnetic storm conditions are likely on 17 May. All enhancements in geomagnetic field activity are associated with the anticipated influence of multiple, recurrent CH HSSs. The remaining days of the outlook periods are expected to be mostly quiet.

Don’t forget to visit our live space weather and radio propagation web site, at: http://SunSpotWatch.com/

Live Aurora mapping is at http://aurora.sunspotwatch.com/

If you are on Twitter, please follow these two users:
1. https://Twitter.com/NW7US
2. https://Twitter.com/hfradiospacewx

Check out the stunning view of our Sun in action, as seen during the last five years with the Solar Dynamics Observatory (SDO):
https://www.youtube.com/watch?v=zXN-MdoGM9g

= = = = =

BOOK SALE: Space Weather and Sun Science – get these from Amazon, and help us stay online!

NOTICE: When you buy this (or any item after starting with this link), you are helping us keep our SunSpotWatch.com and other resources “on the air” (up and running!). In other words, you are helping the entire community. So, check out this book:

Here is the link to Amazon:
http://g.nw7us.us/fbssw-aSWSC

We’re on Facebook: http://NW7US.us/swhfr

from toptenrss https://ift.tt/2HqJJid
via IFTTT

Today’s graph, plotting the SESC sunspot number, the…

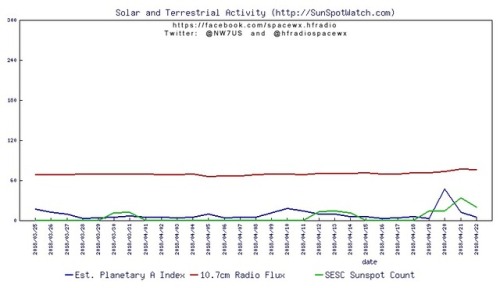
Today’s graph, plotting the SESC sunspot number, the 10.7cm Radio Flux, and the Estimated Planetary A Index, for the last 30 days.

The numbers are:


   Date    | Sunspots | 10.7-cm Flux |  Ap 
==========================================
2018/04/22 |     20   |     76       |   5
2018/04/21 | 34 | 77 | 12
2018/04/20 | 14 | 73 | 47
2018/04/19 | 14 | 71 | 3
2018/04/18 | 0 | 71 | 6
2018/04/17 | 0 | 69 | 4
2018/04/16 | 0 | 69 | 3
2018/04/15 | 0 | 71 | 6
2018/04/14 | 11 | 70 | 6
2018/04/13 | 14 | 70 | 9
2018/04/12 | 13 | 70 | 9
2018/04/11 | 0 | 68 | 14
2018/04/10 | 0 | 69 | 18
2018/04/09 | 0 | 69 | 11
2018/04/08 | 0 | 68 | 5
2018/04/07 | 0 | 67 | 5
2018/04/06 | 0 | 67 | 4
2018/04/05 | 0 | 66 | 9
2018/04/04 | 0 | 69 | 5
2018/04/03 | 0 | 68 | 4
2018/04/02 | 0 | 68 | 5
2018/04/01 | 0 | 69 | 5
2018/03/31 | 12 | 69 | 7
2018/03/30 | 11 | 69 | 5
2018/03/29 | 0 | 69 | 4
2018/03/28 | 0 | 69 | 3
2018/03/27 | 0 | 68 | 9
2018/03/26 | 0 | 68 | 12
2018/03/25 | 0 | 68 | 17

For complete live data and images visit http://SunSpotWatch.com

Be sure to share this post, to spread the love!

Check out the stunning view of our Sun in action, as seen during the last five years with the Solar Dynamics Observatory (SDO):
https://www.youtube.com/watch?v=zXN-MdoGM9g

-=-=-=-=-=-

What’s the difference between CB & amateur (ham) radio? Here ia a video with an opinion by our curator, Tomas (amateur radio operator, NW7US): Did NCIS TV Show Malign the Amateur Radio Service? https://www.youtube.com/watch?v=pIWJ7kKbxiM?t=1m33s

-=-=-=-=-=-

If you are on Twitter, please follow these two users:

1) https://Twitter.com/NW7US
2) https://Twitter.com/hfradiospacewx

We’re on Facebook: http://NW7US.us/swhfr

from toptenrss https://ift.tt/2qQpYui
via IFTTT

Did you know? Here’s a space weather and radio…

Did you know? Here’s a space weather and radio propagation educational tidbit – from http://SunSpotWatch.com – at 14:00 UTC on 2018-04-23:

Our magnetosphere deflects much of the solar wind, around the Earth, generating energy. When this stored solar wind energy is released by the magnetosphere, a ‘geomagnetic substorm’ is triggered.

A geomagnetic storm is made up of many substorms, and the geomagnetic storm can have serious impact on the ionosphere.

Geomagnetic storms are almost always associated with a decreases in F-region electron density. Geomagnetic storms can result in a lowering of the maximum usable frequency of a radio path between two points on the Earth. In short, a geomagnetic storm can cause difficulties in communicating over long distances on shortwave radio frequencies.

Geomagnetic storms are rated by NOAA on a scale, G1 to G5, G5 being severe.

= = = =

What’s the difference between CB & amateur (ham) radio? Here ia a video with an opinion by our curator, Tomas (amateur radio operator, NW7US): Did NCIS TV Show Malign the Amateur Radio Service? https://www.youtube.com/watch?v=pIWJ7kKbxiM?t=1m33s

= = = =

If you are on Twitter, please follow these two users:

1) https://Twitter.com/NW7US
2) https://Twitter.com/hfradiospacewx

..

from toptenrss https://ift.tt/2qUOWI9
via IFTTT

RSGB presentation on RF Interference

Digital-Frequency-DialMany thanks to SWLing Post contributor, Gary (W4EEY), who writes:

I want to recommend an excellent presentation on RF Interference from
the Radio Society of Great Britain (RSGB) Convention in 2015. The
presenter is Ian White, GM3SEK, who has a Blog website here:

https://gm3sek.com/

You can find the presentation video on YouTube here:

Click here to view on YouTube.

The presentation runs for about one hour and contains some valuable
information to help you fight noise and interference in your shack.

Thanks for the tip, Gary!

from toptenrss https://ift.tt/2HoptSo
via IFTTT

Today’s Sun (artificially-colored in yellow) seen at the…

Today’s Sun (artificially-colored in yellow) seen at the 171-angstrom wavelength (Extreme Ultraviolet, or EUV), as viewed by the Solar Dynamics Observatory (SDO), by the Atmospheric Imaging Assembly (AIA).

At this wavelength, at a wavelength not seen by the un-aided eye, we observe the Sun with the 17.1 nm (171 A) filter. This Extreme Ultraviolet (EUV) waveband is used to monitor the corona and upper transition region. With this filter, we can see the myrid of massive magnetic field lines, from simple to complex, that weave and twist throughout the Sun.

The image is a ‘false color image’, meaning that observed data are in a range outside of what human eyes can see, so the data are digitally recast into colors that emphasize physically important features. This view is created from data gathered by the Solar Dynamics Observatory (SDO) satellite that flies above Earth’s atmosphere in an inclined geosynchronous orbit.

Emissions captured in this image come from iron (Fe), a trace element in the solar atmosphere that emits Extreme Ultraviolet (EUV) light when heated to temperatures in excess of one million deg K. In the solar corona the temperatures are so high that most chemical elements have lost many of their electrons. Some of the remaining electrons still attached to the atom emit EUV radiation in narrow wavebands or lines.

The 17.1 nm filter, or channel, is dominated by emissions from highly ionized iron: 8 times ionized (missing 8 electrons) iron–Fe IX. The roman numeral descriptors are consistent with spectral notation: the level of ionization for a given roman numeral is one unit larger that the actual number of missing electrons. The temperatures associated with this level of ionization is about 6 x 10^5 K.

The bright regions in this image correspond to regions of closed magnetic field loops that trap the hot, emitting plasma. Large bright regions are often called active regions. The dark regions correspond to cooler temperatures and possibly to locations where magnetic field lines open into the heliosphere, and thus, do not trap hot plasma.

View live data and images at http://SunSpotWatch.com

= = = =

BOOK SALE: Space Weather and Sun Science – get these from Amazon, and help us stay online!

NOTICE: When you buy this (or any item after starting with this link), you are helping us keep our SunSpotWatch.com and other resources “on the air” (up and running!). In other words, you are helping the entire community. So, check out this book:

Here is the link to Amazon:
http://g.nw7us.us/fbssw-aSWSC

= = = =

Visit our live space weather and radio propagation web site, at: http://SunSpotWatch.com

See the live aurora mapping is at http://aurora.sunspotwatch.com

If you are on Twitter, please follow these two users:

1) https://Twitter.com/NW7US
2) https://Twitter.com/hfradiospacewx

We’re on Facebook: http://NW7US.us/swhfr

from toptenrss https://ift.tt/2HTVFtR
via IFTTT

Latest TEC map from NASA. What is TEC? Total Electron Content…

Latest TEC map from NASA. What is TEC? Total Electron Content (or TEC) is an important descriptive quantity for the ionosphere of the Earth. TEC is the total number of free electrons integrated between two points, along a tube of one meter squared cross section, i.e., the electron columnar number density. Affected by solar activity, Total Electron Content (TEC) describes the total number of free electrons present within one square meter between two points (i.e. between the receiver and satellite involved in measuring TEC).

These maps are also used to monitor ionospheric weather, and to nowcast ionospheric storms that often occur responding to activities in solar wind and Earth’s magnetosphere as well as thermosphere.

View live data and images at http://SunSpotWatch.com

Follow: https://Twitter.com/NW7US and https://Twitter.com/hfradiospacewx

Facebook: http://NW7US.us/swhfr

And: Check out the stunning view of our Sun in action, as seen during the last five years with the Solar Dynamics Observatory (SDO):
https://www.youtube.com/watch?v=zXN-MdoGM9g

= = = =

BOOK SALE: Space Weather and Sun Science – get these from Amazon, and help us stay online!

NOTICE: When you buy this (or any item after starting with this link), you are helping us keep our SunSpotWatch.com and other resources “on the air” (up and running!). In other words, you are helping the entire community. So, check out this book:

Here is the link to Amazon:
http://g.nw7us.us/fbssw-aSWSC

= = = =

See the live aurora mapping is at http://aurora.sunspotwatch.com

If you are on Twitter, please follow these two users:

1) https://Twitter.com/NW7US
2) https://Twitter.com/hfradiospacewx

We’re on Facebook: http://NW7US.us/swhfr

from toptenrss https://ift.tt/2Hm37gb
via IFTTT

Latest TEC map from NASA. What is TEC? Total Electron Content…

Latest TEC map from NASA. What is TEC? Total Electron Content (or TEC) is an important descriptive quantity for the ionosphere of the Earth. TEC is the total number of free electrons integrated between two points, along a tube of one meter squared cross section, i.e., the electron columnar number density. Affected by solar activity, Total Electron Content (TEC) describes the total number of free electrons present within one square meter between two points (i.e. between the receiver and satellite involved in measuring TEC).

These maps are also used to monitor ionospheric weather, and to nowcast ionospheric storms that often occur responding to activities in solar wind and Earth’s magnetosphere as well as thermosphere.

View live data and images at http://SunSpotWatch.com

Follow: https://Twitter.com/NW7US and https://Twitter.com/hfradiospacewx

Facebook: http://NW7US.us/swhfr

And: Check out the stunning view of our Sun in action, as seen during the last five years with the Solar Dynamics Observatory (SDO):
https://www.youtube.com/watch?v=zXN-MdoGM9g

= = = =

BOOK SALE: Space Weather and Sun Science – get these from Amazon, and help us stay online!

NOTICE: When you buy this (or any item after starting with this link), you are helping us keep our SunSpotWatch.com and other resources “on the air” (up and running!). In other words, you are helping the entire community. So, check out this book:

Here is the link to Amazon:
http://g.nw7us.us/fbssw-aSWSC

= = = =

See the live aurora mapping is at http://aurora.sunspotwatch.com

If you are on Twitter, please follow these two users:

1) https://Twitter.com/NW7US
2) https://Twitter.com/hfradiospacewx

We’re on Facebook: http://NW7US.us/swhfr

from toptenrss https://ift.tt/2Hm37gb
via IFTTT